This is just a short blog post on my recent experience and observations from my first GISRUK conference in Newcastle, UK. The conference started with four workshops over the first two days along with sixty presentations and ~200 attendees over the course of the week.
The slides from my presentation “Change in Artificial Land Use over time across European Cities: A rescaled radial perspective” can be found here.
Workshops
The first workshop was given by Prof. Nick Holliman of Newcastle University looking at data visualisation and exploring the use of Microsoft Power Bi for visualising data. He also presented some of the data currently being collected in the Newcastle Urban Observatory using censors.
The second workshop explored the use of API’s, what they are and how to use them. This workshop was run by researchers from the Newcastle Urban Observatory. Materials from the API workshop can be found here.
The workshop on Wednesday morning was run by Dr. Robin Lovelace and Dr. Nick Bearman and explored mapping in R. Robin presented some materials from his latest book ‘Geocomputation with R’. More details of the book here. Documents and reproducible code from the GIS mapping in R workshop can be found here.
Finally the last workshop was given by Dr. Laura Hanson along with a number of other researchers and spatial analysts from both the private and public sector.
Conference
One of the main trends I picked up from this conference was the use of visual aids and GIF’s created in R. Any of the presentations which used these presented their research in a particularly powerful way. As researchers one of the biggest challenges is presenting our research in a format which is quick and easy to understand. This can be difficult and sometimes require many graphs, figures and tables to get a point across. Such animations present research in a dynamic way.
From an organisational viewpoint the name badges and reusable coffee cup given out at the start of the conference were two welcome features. The name badges made the first name particularly easy to read without a need to strain your eyes while the coffee cups meant a substantial reduction in disposable coffee cup usage given the approximate 200 attendance.
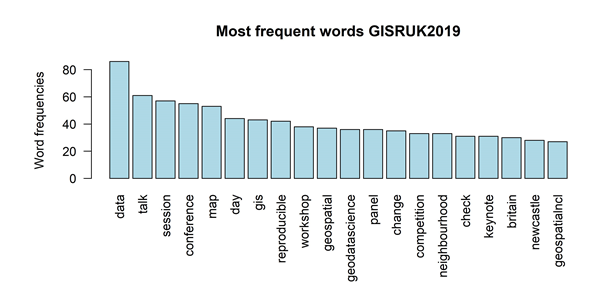
An analysis of the tweets from the conferences reveals some interesting trends. It was not surprising to see the term ‘reproducible’ so high up the list. There is a growing number of publications and producing reproducible research along with the code is fast becoming the norm. Representing the code from R or PyQGIS on GitHub alongside the results that appear in the academic article or conference presentation. It is heartening to see such sharing of knowledge in the geocomputation community and will surely only lead to better outcomes in terms of improved research and evidence for policymakers.Code for carrying this out in R can be found in my GitHub here.
Newcastle
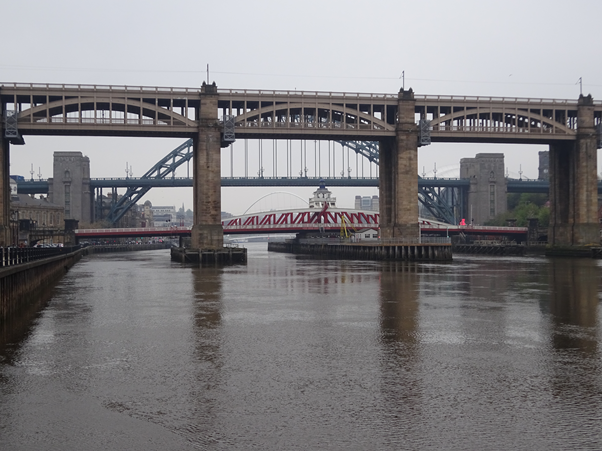
One of the most famous features of Newcastle are the seven bridges which cross the River Tyne ranging in both size and age.
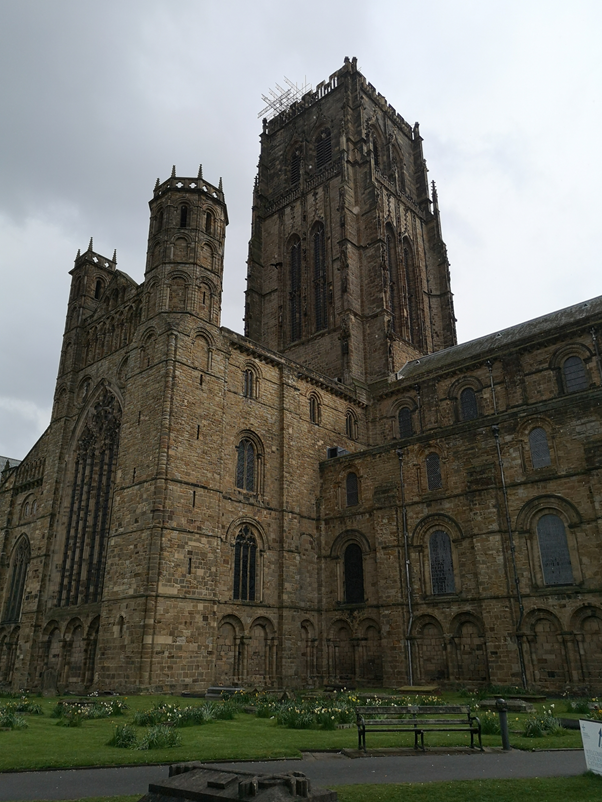
There is also the Newcastle castle and gate house. There is a good mixture in this city of both the new with the historic. Nearby Newcastle is situated Durham Cathedral. Construction started in 1093. The cathedral houses the relics of Saint Cuthbert.
The compactness of the city was evident throughput. Public transport also made it very easy to get around with intercity trains, buses and a metro. The city appears to be going from strength to strength.
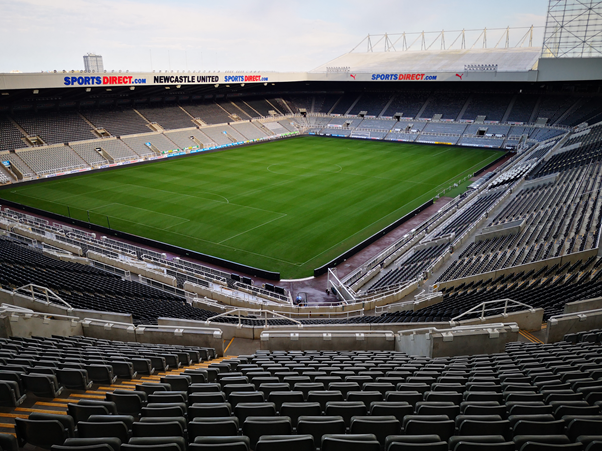
The conference dinner took place at St. James’s Park home to Newcastle United FC. The pride of the north east (although I am not sure Sunderland or Middlesbrough fans will agree!!) it has been a trophy less period for the magpies over the last couple of decades despite coming close to breaking Manchester United’s dominance in the mid-nineties under Kevin Keegan. An impressive stadium it has a certain character that a lot of modern stadia lack.